
Track two things together, never separately: duplicate volume (opened per period, duplicate rate, net duplicate backlog) and detection quality (precision, recall, Recall@K). Segment every number by source, product area, release, and reporter cohort before drawing conclusions, because raw counts lie about whether your product is getting worse or your reporting pipeline is just getting noisier. Pair the two, or you’re measuring nothing useful.
TL;DR:
- Tracking duplicate volume without segmentation can mislead teams into chasing false problems, so metrics must be broken down by source, product, version, severity, and reporter type.
- The net duplicate backlog is more indicative of triage capacity issues than raw ticket counts, especially when it increases despite a stable total bug count.
- Precision, recall, and Recall@K are essential for evaluating detection quality, with the latter measuring whether the correct duplicate appears within the top K suggestions.
- Automated triage should rely on confidence thresholds that suggest human review for medium-confidence matches while auto-linking only high-confidence duplicates to avoid missed or wrongly linked bugs.
- Incorporating richer data such as screen recordings and transcripts improves duplicate detection accuracy and reduces false links compared to text-only systems.
Table of Contents
- Core Duplicate Bug Metrics to Track and Why They Matter
- How to Measure Detection Quality: Precision, Recall, and Recall@K
- Building Dashboards That Don’t Mislead You
- The Triage Workflow That Actually Reduces Duplicate Noise
- Retrieval vs. Classification: The Engineering Trade-off Behind Duplicate Detection
- Perspective: Practitioner Pitfalls and Governance Tips
- How Duplicate Bugs Drain Development Velocity
- Best Practices for Preventing Duplicate Bug Submissions
- What Changes When Teams Actually Track These Metrics
- Fitting Duplicate Metrics Into Your Broader QA Process
- Wezard Turns Better Bug Reports Into Cleaner Metrics
- Sources
- FAQ
Core Duplicate Bug Metrics to Track and Why They Matter
Duplicate rate alone tells you almost nothing. A rate that climbs from 12% to 22% could mean your product broke something big, or it could mean a new intake form made reporting easier and more people are filing the same known issue. You cannot tell the difference without segmentation.
Start with three volume metrics: duplicates opened per period, duplicate rate (duplicates divided by total reports in that window), and net duplicate backlog (duplicates opened minus duplicates resolved or linked). The third number matters more than people think. A stable duplicate rate can still hide a backlog that’s quietly growing because your triage team can’t keep up with linking volume.
Below that, track cluster-level metrics. A cluster is a master ticket plus every report linked to it. Cluster size tells you how many people hit the same bug. Time-to-first-master tells you how fast triage recognized the pattern. Reports-per-master, averaged across active clusters, flags whether one loud incident is skewing your whole duplicate count.
Segment everything by:
- Source (support ticket, in-app report, automated crash log)
- Product area or component
- Release or build version
- Severity
- Reporter cohort (new user, power user, internal QA)
Before calculating anything, normalize your data. Filter out anything that isn’t actually a bug (feature requests, questions, environment issues) and harmonize status labels across trackers, since “duplicate,” “dupe,” and “linked” often mean the same thing in different systems. The Metabase guide to bug count metrics recommends exactly this: normalize first, then compute rate, because raw tracker counts inflate or deflate based on inconsistent tagging alone.
How to Measure Detection Quality: Precision, Recall, and Recall@K
Volume metrics tell you how much duplicate noise exists. They don’t tell you whether your detection system is actually catching it. For that, you need a confusion matrix.
A true positive is a duplicate your system correctly flags. A false positive is a unique bug your system wrongly links to an existing ticket, which risks burying a real issue. A false negative is a duplicate your system misses, which means two engineers might work the same fix. Precision tells you what fraction of flagged matches are correct; recall tells you what fraction of actual duplicates you caught; F1 balances the two when neither can be sacrificed.
For ranked suggestion systems, which is what most modern duplicate detectors actually are, Precision and Recall don’t fully apply the same way. Instead, teams report Recall@K and Precision@K, measuring whether the correct match appears within the top K suggestions. DBRD research commonly reports RR@10 as a standard retrieval metric means the correct duplicate should land in the top 10 candidates.
Statistic worth remembering: one industrial case study found retrieval success of 94.44%, meaning the correct duplicate almost always appeared somewhere in the candidate list. But testers only correctly identified the duplicate from those candidates 75% of the time. That 19-point gap is the whole argument for measuring human-tool agreement separately from retrieval success.
Set threshold tiers based on confidence:
- High confidence: auto-link without human review
- Medium confidence: suggest to a human reviewer
- Low confidence: allow the report through unblocked
Building Dashboards That Don’t Mislead You
A duplicate-metrics dashboard fails the moment someone reads a rate spike as a quality problem when it’s actually a reporting-volume problem, or vice versa. Structure panels to prevent that confusion, not just to display numbers.
- Opened vs. closed duplicates over time, broken into age buckets (0 to 7 days, 8 to 30, 30-plus), so you can see whether old duplicates are piling up or fresh ones are getting linked fast.
- Net duplicate backlog with severity mix, since a backlog full of low-severity cosmetic dupes is a very different problem than one full of critical crash reports.
- Cluster growth and median time-to-master, tracked by component, to spot which product areas generate repeat reports of the same underlying defect.
- Reporter cohort panels, separating new users from repeat testers, since new users tend to file duplicates at a much higher rate simply because they haven’t seen the backlog.
Document your evaluation window, tracker mix, and duplicate definition on every dashboard. Research on duplicate bug report detection benchmarks found that data age and tracker identity materially change measured performance, so a dashboard without those parameters stated is not reproducible, even internally.
Pro Tip: Screenshot and archive your dashboard definitions quarterly. When someone asks why the duplicate rate “changed” six months ago, you want the exact filter and window on hand, not a guess.
The Triage Workflow That Actually Reduces Duplicate Noise
Reducing duplicate noise isn’t about blocking submissions. It’s about giving triage a fast, low-friction path from raw report to resolved link. The workflow that works in practice runs in four steps: search for existing matches, surface ranked candidates, route to human review at the right confidence level, and either link to a master or spin up a new one.
That threshold routing is the operational core. Research on cost-sensitive threshold policies recommends auto-linking only high-confidence matches, suggesting medium-confidence matches for a human decision, and letting low-confidence reports through without friction. Blocking submissions at low confidence risks losing real bugs that just happen to phrase things differently than the master ticket.
A few things to log at every review step:
- The similarity score the model produced
- Whether the human accepted or overrode the suggestion
- The stated reason for any override
- The final outcome (linked, new master, closed as invalid)
Add a missed-reopen metric to your tracking: tickets closed as duplicates that later get reopened because they weren’t actually the same issue. This single number, tracked over time, is one of the clearest signals that your cluster classification needs tuning, and it’s often the first metric that catches model drift before precision or recall does.
Retrieval vs. Classification: The Engineering Trade-off Behind Duplicate Detection
Most production duplicate detectors aren’t a single model. They’re a retrieval step (find candidates fast) followed by a classification step (rank or confirm the best match). Retrieval alone scales well because it’s cheap to run against thousands of tickets. Classification alone is more accurate per pair but too slow to run against an entire backlog.

Research combining retrieval and classification found that hybrid systems trade a small amount of accuracy for a large gain in runtime efficiency, with SBERT-style models commonly used for the retrieval pass and RoBERTa-style models for the classification pass. For a tracker with tens of thousands of open tickets, that trade-off usually favors retrieval-first architecture.
What to log in production, regardless of architecture:
- Every candidate suggestion and its similarity score
- The confidence threshold applied at that moment
- The human decision and any override reason
- The final master outcome
Pro Tip: If you switch trackers or migrate ticket history, re-run your benchmark before trusting the new precision numbers. Tracker identity alone changes measured performance, even with an identical model.
Perspective: Practitioner Pitfalls and Governance Tips
Most teams compute duplicate rate straight from raw counts and wonder why the number swings wildly between releases. Normalize first. Filter non-bugs, harmonize statuses, and only then calculate anything.
Tracking individual tickets instead of clusters is the second common mistake. Cluster size and time-to-first-master tell you whether one incident is driving your whole duplicate count, which raw ticket totals never reveal.
Measure human-tool agreement on a schedule, not once. Audit overrides monthly, and publish your evaluation window and duplicate definition every time you report a number. Benchmarks decay quietly as your tracker and reporter base change.
— Marketing
How Duplicate Bugs Drain Development Velocity
Every duplicate that reaches an engineer’s queue costs real time twice: once when someone triages and links it, and again if it slips through and a second engineer starts investigating a bug that’s already fixed or already assigned. That second scenario is the expensive one. It’s not just wasted hours, it’s context-switching cost, since an engineer pulled off a sprint task to investigate a “new” crash that turns out to be a known issue rarely returns to their original task at full speed.
Resource allocation suffers in a less visible way too. Sprint planning that treats duplicate-inflated backlog counts as real, distinct work will consistently overestimate scope. A backlog showing 340 open bugs looks very different from one showing 340 open bugs where 90 are unlinked duplicates of 40 actual defects. Teams planning against the first number will overallocate QA and engineering time to a problem that’s smaller than it appears, and underallocate time to the release testing that would have caught the real issues earlier.
The net duplicate backlog metric exists specifically to catch this. When it climbs even while total ticket count looks flat, that’s often a sign triage capacity hasn’t kept pace with reporting volume, not that the product suddenly got worse. Teams that separate these two signals make sharper calls about whether to hire more QA capacity or fix a broken intake process. Teams that don’t tend to solve the wrong problem, repeatedly, every release cycle.
Best Practices for Preventing Duplicate Bug Submissions
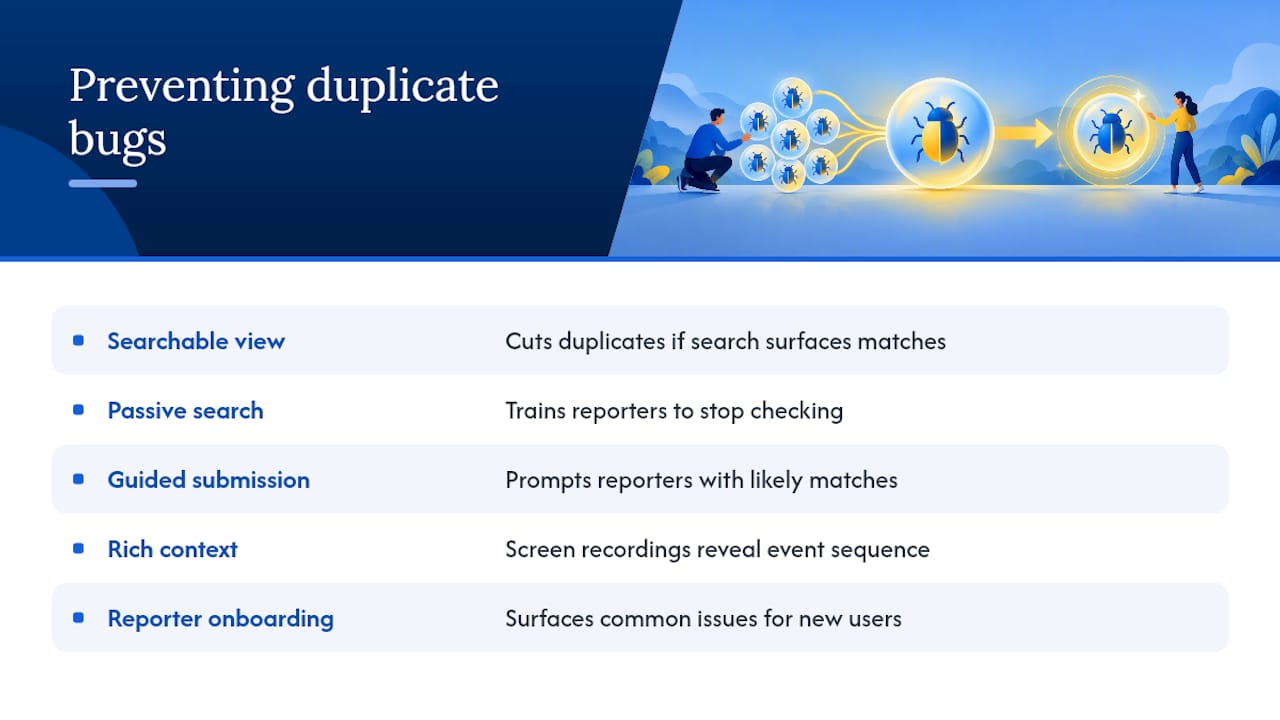
Prevention beats detection, and the cheapest place to stop a duplicate is before it’s ever filed. Most duplicate-prevention advice focuses on the reporter’s side of the process, and for good reason: reporters can’t check for existing tickets they don’t know exist.
A searchable, well-tagged existing-issues view at the point of submission cuts duplicates meaningfully, but only if the search actually surfaces relevant matches. A search box that returns nothing useful trains reporters to stop checking altogether, which defeats the purpose. Guided ticket submission, where the reporter is prompted with likely existing matches based on what they’ve typed or shown, works better than a passive search bar because it puts the burden on the system, not the reporter’s memory of what might already be logged.
Capturing richer context at submission time also reduces accidental duplicates that are really the same bug described differently. Two reports describing “the button doesn’t work” and “checkout fails on submit” can be the same defect, but text-only intake often can’t tell. Screen recordings and real-time transcriptions capture the actual sequence of events, which makes it far easier for a detection system or a human triager to recognize the match, even when the written descriptions don’t overlap at all.
Reporter cohort tracking matters here too. New users file duplicates at higher rates simply because they haven’t seen the backlog, so onboarding flows that surface common known issues before submission reduce noise disproportionately for that group. Refer back to the causes of duplicate bug reports for the underlying reporting behaviors driving this.
What Changes When Teams Actually Track These Metrics
Teams that move from ad hoc duplicate handling to structured metrics tend to see the same pattern: the first few weeks reveal a backlog that’s worse than anyone realized, and then triage gets measurably faster.
Consider a mid-size QA team running weekly bug review meetings that used to spend the first twenty minutes just arguing about whether a ticket was a duplicate. Once they started tracking cluster size and time-to-first-master, that argument mostly disappeared, because the dashboard already showed which cluster a new report likely belonged to and how confident the match was. Meeting time shifted from disputing duplicates to actually triaging the real defects underneath them.
The bigger shift usually happens around the missed-reopen metric. Teams that start tracking it often find their auto-link threshold was set too aggressively, closing valid unique reports as duplicates because the similarity score crossed the threshold without a human ever looking at it. Dialing that threshold back, and routing more matches to the “suggest” tier instead of “auto-link,” typically reduces missed-reopens within a release or two, at the modest cost of a few more manual reviews.
None of this requires exotic tooling. It requires consistent normalization, a dashboard that separates volume from quality, and a habit of reviewing the threshold policy on a schedule instead of setting it once and forgetting about it. The gains come from measurement discipline more than from any single algorithm.
Fitting Duplicate Metrics Into Your Broader QA Process
Duplicate metrics are only useful if they connect to the rest of your quality assurance pipeline, not sit as a side dashboard nobody checks during sprint planning. The natural integration point is triage itself: duplicate detection should happen at the same moment severity and priority get assigned, not as a separate pass afterward.
That means your bug tracker’s workflow states need to reflect cluster status, not just individual ticket status. A ticket linked as a duplicate should carry a visible reference to its master, and the master’s severity should roll up any escalation signal from its cluster (if five people report the same crash, that’s a signal worth weighing even if each individual report reads as low severity). Tools like Jira and Azure DevOps support custom fields and automation rules that can enforce this link, but the policy has to be defined by the QA process first. Automation without a clear threshold policy just automates inconsistency faster.
Release retrospectives are the other natural checkpoint. Reviewing net duplicate backlog and missed-reopen rates alongside defect escape rate and test coverage gives a fuller picture of where quality actually broke down, rather than treating duplicates as a separate, lower-priority bookkeeping problem. Teams that fold duplicate metrics into standard QA reporting, rather than tracking them in a spreadsheet nobody opens, tend to catch threshold drift and reporting-pipeline changes months earlier than teams that check duplicate stats only when the backlog visibly balloons.
Wezard Turns Better Bug Reports Into Cleaner Metrics
Most duplicate-detection systems only have text to work with, which is exactly why the retrieval-versus-human-identification gap exists in the first place. Wezard changes what enters your metrics pipeline before detection even runs, by recording the reporter’s screen and transcribing the issue in real time, so the system comparing new reports against existing tickets has actual context instead of a two-line description.
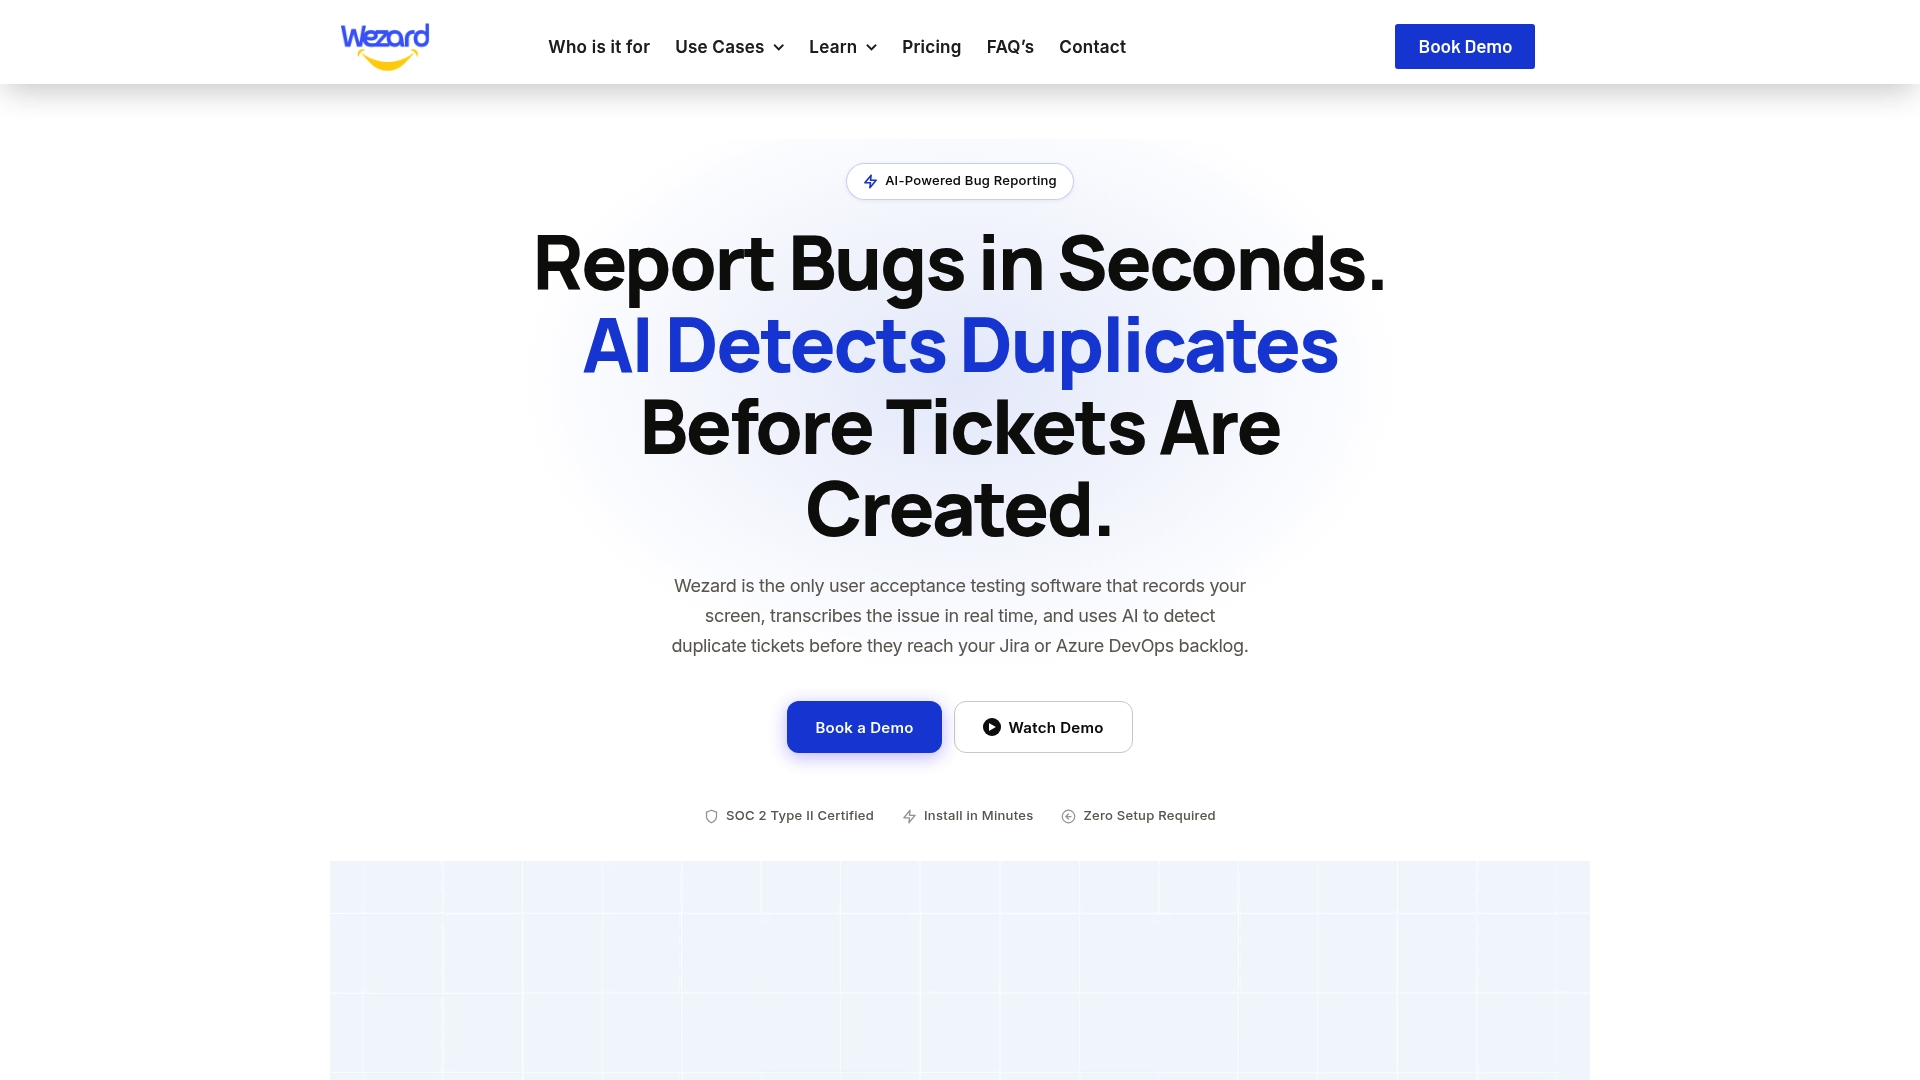
That richer input feeds directly into cleaner duplicate rate and net backlog numbers, because fewer reports get missed for lacking detail and fewer valid reports get wrongly auto-linked for looking similar in text alone. Wezard’s AI-powered duplicate detection surfaces likely matches before a ticket ever reaches your Jira or Azure DevOps backlog, and every suggestion, override, and final outcome is available for the audit trail your threshold-tuning depends on. Fewer duplicate tickets landing in the backlog also means cleaner master tickets, since the reports that do get linked carry a recording and transcript instead of a guess. Plans start with Starter at $25 per month, scaling up to Team and Business tiers as your reporting volume grows. Check the Wezard pricing page to see which tier fits your current ticket volume and start reducing duplicate noise at the point of capture.
Sources
- Bug count metrics and dashboards (Metabase example)
- Recall@K guidance from DBRD literature
- Industrial case study on retrieval vs human identification
- Study recommending cost-sensitive threshold policies for duplicate handling
FAQ
How Many Bugs Per 1,000 Lines of Code Is Normal?
Industry defect-density figures vary widely by codebase maturity and testing rigor, and no single number applies universally across languages or industries. Instead of chasing a defect-density benchmark, most QA teams get more value from tracking duplicate rate and net duplicate backlog trends within their own codebase over time.
How Do You Detect Duplicate Data in a Bug Tracker?
Duplicate detection typically combines a retrieval step, which finds similar candidate tickets using text or semantic similarity, with a classification or ranking step that scores confidence. Systems commonly report Recall@K to measure whether the true match appears in the top suggestions, then apply threshold rules to decide auto-link, suggest, or pass-through.
What Is the Difference Between a Bug and a Defect?
A defect is a flaw in the code itself, something wrong in the implementation relative to requirements. A bug is typically the reported symptom a tester or user observes, which may or may not map one-to-one to a single defect, since one defect can generate many duplicate bug reports across different testers.
Which Tools Are Commonly Used for Bug Tracking?
Jira and Azure DevOps are the two most widely used backlog systems for logging and managing bugs, and both support custom automation for duplicate handling. Wezard integrates with both, capturing screen recordings and transcriptions at the point of report and surfacing AI duplicate suggestions before tickets reach the backlog.
What’s the Best First Metric to Start Tracking?
Start with net duplicate backlog segmented by product area, since it reveals whether triage capacity is keeping pace with reporting volume better than duplicate rate alone. Pair it with a basic precision check on any auto-linking rule you already have in place before adding more automation.