
Mean time to resolve (MTTR) is the average time it takes your team to fix an incident from the moment it starts until service is fully restored and verified. The formula is simple: total resolution time across all incidents divided by the number of incidents. Lower MTTR means less downtime, less user impact, and directly higher availability.
TL;DR:
- Confirm your team clearly defines the start and end triggers, measurement units, and time scope to ensure MTTR data is consistent and comparable.
- Outliers from delayed incidents, mislabeling, or unrelated issues can inflate MTTR averages, so segment data by severity and report medians alongside means.
- Improving detection, triage, diagnosis, and automation can significantly reduce MTTR, with diagnosis often being the most impactful phase to target first.
- Using quality bug reports with real-time recordings and AI-based duplicate detection can dramatically shorten diagnosis and triage times.
- Balancing speed and durability involves prioritizing fast identification and diagnosis before comprehensive root-cause analysis to keep incident resolution quick and sustainable.
Table of Contents
- Mean Time to Resolve: The Formula and What Counts
- Calculating MTTR: Worked Examples and Common Pitfalls
- How MTTR Relates to MTBF, MTTD, and MTTA
- MTTR Benchmarks: What “Good” Actually Looks Like
- What Actually Drives MTTR Up
- How to Reduce Mean Time to Resolution
- Where Bug Report Quality Fits Into the MTTR Equation
- Fast Fixes Versus Permanent Fixes
- A Faster Path to Shorter Diagnosis Times
- Sources
Mean Time to Resolve: The Formula and What Counts
The canonical formula is straightforward: MTTR = Total Time to Resolve All Incidents ÷ Number of Incidents. The tricky part isn’t the math. It’s agreeing on what “total time” actually spans. Some teams stop the clock the moment service is restored. Others keep it running through root-cause diagnosis and post-fix verification, and that choice can double or triple your reported number without anything actually changing operationally, as ManageEngine notes.
Before you trust any MTTR dashboard, confirm your team has settled on:
- The start trigger: first alert fired, first human acknowledgment, or customer report received
- The end trigger: service restored, root cause identified, or fix verified in production
- The time unit: minutes for customer-facing severity 1 incidents, hours for internal tooling issues
- The measurement window: rolling 30 days, per sprint, or per quarter
Practitioners at Atlassian recommend documenting these choices in a runbook rather than letting each on-call engineer interpret them differently. Two teams reporting “45 minutes” and “3 hours” for the same kind of incident might just be measuring different things.
Calculating MTTR: Worked Examples and Common Pitfalls
Say your team resolved four incidents last week in 20, 30, 45, and 25 minutes. Add them: 120 minutes. Divide by four incidents. MTTR = 30 minutes.
Now change one variable. That third incident wasn’t 45 minutes, it was 45 hours, because it got misfiled as low priority over a weekend. Your total jumps to 2,895 minutes across four incidents, and MTTR balloons to over 12 hours. One mislabeled ticket wrecked your entire weekly average.
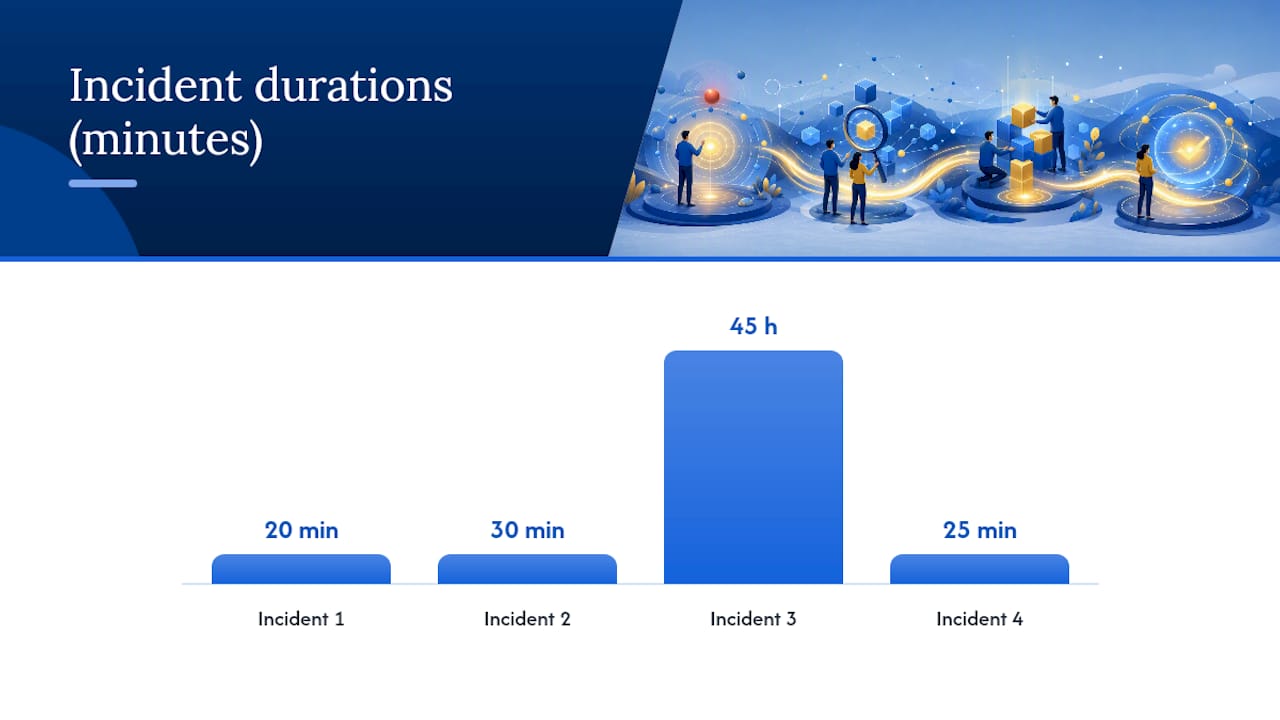
That’s the core danger with MTTR as a single aggregate number. A few outliers, especially incidents delayed by holidays, on-call handoffs, or slow escalation, can distort the mean far more than the median experience your users actually had.
Three practical fixes:
- Normalize timestamps across all tools feeding your incident data, so a PagerDuty alert and a Jira ticket agree on when the clock started.
- Segment by severity and service before averaging, so a critical payment outage isn’t blended with a low-priority UI glitch.
- Flag and separately report outliers (incidents resolved outside 3x the median) rather than letting them silently inflate the mean.
Pro Tip: Track median resolution time alongside the mean. If they diverge significantly, you have outliers skewing your headline number, and that gap itself is worth investigating.
How MTTR Relates to MTBF, MTTD, and MTTA
MTTR doesn’t operate alone. It’s one piece of a small family of metrics that together tell you how reliable a system actually is.
- MTTD (mean time to detect): how long between something breaking and someone noticing
- MTTA (mean time to acknowledge): how long between detection and a human taking ownership
- MTBF (mean time between failures): how often incidents happen in the first place
- MTTR (mean time to resolve): how long each incident takes to fix once it’s underway
These connect through the availability formula: Availability is calculated as the ratio of mean time between failures to the sum of mean time between failures and mean time to resolve, reflecting how uptime and repair times combine to determine service availability, as MetricGate explains. MTBF and MTTR are genuinely different levers. One measures how often things break; the other measures how fast you fix them when they do. For the same failure rate, cutting MTTR in half improves availability just as much as doubling the interval between failures, and it’s usually the faster lever to pull since you control your response process directly, while failure frequency often depends on code quality and infrastructure you can’t fix overnight. Detection speed alone can swing your MTTR dramatically, since the clock often starts well before anyone notices a problem, as Sumo Logic points out.
MTTR Benchmarks: What “Good” Actually Looks Like
Industry data draws a clear line between tiers of performance. Elite teams resolve incidents quickly, high performers take a few hours, medium performers take longer, and low performers often take a full day or more per incident, according to OpenObserve’s benchmarking.
That spread often comes down to tooling and process discipline rather than raw engineering talent. Don’t copy a single target across your whole org, though. A payment-processing outage and a stale internal dashboard shouldn’t share an MTTR goal. Set targets per severity tier and per service, and resist the urge to chase a vanity number that looks good in a report but ignores what actually matters to your users.
What Actually Drives MTTR Up
MTTR breaks into four phases, and delay in any one of them compounds. Detection is the time between failure and awareness, often stretched by alert fatigue that buries real signals under noise. Triage is deciding who owns it and how urgent it is, slowed when telemetry lives in five disconnected tools. Diagnosis is finding the actual root cause, dragged out by vague bug reports or missing context. Remediation is deploying and verifying the fix, held back by slow CI/CD pipelines or unclear runbooks.
Beyond the operational side, measurement itself can quietly inflate your numbers:
- Inconsistent start/end timestamp definitions across teams
- Delayed incident closure (marking something resolved days after the fix actually shipped)
- Merging unrelated incidents into one ticket, muddying the true count
- No severity segmentation, so trivial and critical incidents get averaged together
Typical unoptimized phase times can total several tens of minutes to a few hours combined, according to OpenObserve, and each phase is a separate opportunity to cut time.
How to Reduce Mean Time to Resolution
Fixing MTTR works best in this order:
- Standardize measurement first. Agree on start/end definitions and segment by severity and service before you touch tooling. You can’t improve what you’re inconsistently measuring.
- Tighten detection. Full-fidelity observability and anomaly detection that use dynamic baselines catch problems faster than static thresholds, cutting the gap between failure and awareness.
- Speed up triage. Alert correlation and automatic enrichment route the right incident to the right person without a human sifting through five dashboards first.
- Shorten diagnosis. Centralized logs and traces, plus searchable runbooks, cut the guesswork out of root-cause work. This is usually where the most time hides.
- Automate remediation. Feature flags, automated rollback runbooks, and faster CI/CD pipelines let you ship and verify fixes without manual bottlenecks.
- Measure each component separately. Track MTTD, triage time, diagnosis time, and remediation time individually, not just the aggregate MTTR, so you know exactly where to invest next.
Datadog’s research backs this sequence: standardized timestamps, unified observability, and remediation automation are consistently what separates fast-resolving teams from slow ones. AI-assisted observability and automated runbooks tend to produce the biggest relative gains specifically in diagnosis and triage, the two phases most dependent on finding the right context fast.
Pro Tip: If you only fix one phase this quarter, fix diagnosis. It’s usually the longest phase and the one most improved by better context in the original report, not better infrastructure.
Where Bug Report Quality Fits Into the MTTR Equation
Most diagnosis delay isn’t a tooling gap. It’s a context gap. An engineer gets a ticket that says “checkout button doesn’t work” with no reproduction steps, no environment details, and no idea if it’s a duplicate of three other open tickets.
Screen recordings paired with real-time transcription close that gap directly. A tester or QA reviewer records the actual failure as it happens and narrates what they’re seeing, so the engineer receiving the ticket sees the exact sequence instead of reconstructing it from a vague description. That alone removes a common cause of slow diagnosis: back-and-forth clarification threads.
AI-based duplicate detection tackles the triage side. Before a ticket ever reaches your backlog, it gets flagged against existing open issues, so your team isn’t burning diagnosis time on an incident someone already fixed. Combine that with direct sync to Jira or Azure DevOps, and the handoff between “tester found it” and “engineer is fixing it” happens without a manual re-entry step in between.

Fast Fixes Versus Permanent Fixes
The tension in every MTTR conversation is speed versus durability. Rolling back a deploy resolves the incident fast but doesn’t fix why it happened. Chasing root cause every time keeps MTTR high and burns out on-call engineers.
My honest read: prioritize detection and diagnosis tooling before remediation automation. A team that spots problems in two minutes and diagnoses them in ten will beat a team with a flashy auto-rollback system but poor visibility. Write down your MTTR definition in a runbook, tie it to service-level objectives, and stop treating the aggregate number as the whole story.
— Marketing
A Faster Path to Shorter Diagnosis Times
You’ve seen how much of MTTR lives in the diagnosis and triage phases, and how much of that delay traces back to incomplete bug reports and duplicate tickets clogging the backlog. Wezardapp is built around exactly that gap.

It records the screen and transcribes the issue in real time as a tester or reviewer finds it, so the engineer who picks up the ticket gets the full reproduction context on the first read, not the third follow-up message. Its AI checks new reports against your existing backlog and flags duplicates before they ever hit Jira, Azure DevOps, or ServiceNow, which means your team spends triage time on real distinct issues instead of re-diagnosing something already logged. If you’re evaluating how UAT and bug-reporting workflows feed into your incident metrics, see how it compares on the Jira alternatives page, or start a trial to see the diagnosis-time difference on your own backlog.
Sources
For deeper detail on the formulas, benchmarks, and definitions covered here, these sources are worth bookmarking: ManageEngine’s MTTR vs MTTF vs MTBF breakdown, Atlassian’s incident management KPI guide, OpenObserve’s MTTR benchmarking data, and this enterprise incident response checklist for process-level improvements.
- MTBF vs MTTR reliability — MetricGate (2026-02-01)
- Mean Time to Resolution (MTTR): Complete Guide for 2026 — OpenObserve
- MTBF, MTTR, MTTA, and MTTF – Incident Management — Atlassian