
Attach a console log snapshot the moment you file a bug, not after someone asks for it. Include the timestamp, the page URL, your app version, and a screenshot or session ID alongside the log itself. If your team has automatic capture, use it. If not, save the log as a file, strip out anything sensitive, and attach it directly to the ticket instead of pasting it into a comment.
TL;DR:
- Attaching a console log at the moment you file a bug ensures the snapshot includes timestamp, page URL, app version, and relevant session details for better triage.
- Only console messages such as JavaScript errors, warnings during user actions, failed network requests, and custom diagnostics are useful for troubleshooting.
- Use browser developer tools to preserve logs across page loads and export either as text files or HAR files, filtering noisy outputs beforehand.
- Automatic capture tools can simplify log collection by recording console and network data at bug report time, but require filtering sensitive information and careful review before deployment.
- Every bug report should include clear reproduction steps, timestamps, URL, app version, relevant screenshots, and attached sanitized logs and network traces.
Table of Contents
- What Counts as a Console Log Worth Capturing?
- Why Do Console Logs Speed Up Bug Triage?
- How Do You Capture Console Logs in Chrome, Firefox, and Safari?
- Should You Rely on Automatic Console Log Capture?
- How Do You Share Logs Without Leaking Sensitive Data?
- What Should Every Bug Ticket Include?
- How Combining Screen Recording and AI Cuts Duplicate Tickets
- Try Wezard for Automatic Capture and Fewer Duplicate Tickets
- Sources
- FAQ
What Counts as a Console Log Worth Capturing?
Not every line in the browser console matters. The messages that actually help a developer are: JavaScript errors and their stack traces, warnings tied to a specific user action, failed network requests (404s, 500s, timed-out fetches), and custom events your app logs for its own diagnostics.
Timestamps and the current URL or route matter almost as much as the error text itself. A stack trace without context tells a developer what broke, not when or where in the user’s flow it happened, which is often the harder half of the puzzle.
Here’s what belongs in a useful capture:
- Uncaught exceptions and their full stack traces
- Warnings that fired right before or during the reported issue
- Failed XHR/fetch calls, including status codes
- Custom app-level log events (state changes, feature flags, session markers)
Watch for noise. Some apps flood the console with debug output on every render or every keystroke. If that’s happening, filter the console view before exporting, or the useful signal gets buried in hundreds of repeated lines nobody will read.
Why Do Console Logs Speed Up Bug Triage?
A user reporting “the page froze” gives a developer almost nothing to work with. A console log showing an uncaught TypeError on cart.items.map at 2:14 PM, right after a failed /api/checkout call, gives them a starting point in seconds.
That gap between symptom and evidence is where most triage time gets wasted. Attaching logs, instead of pasting them into a comment, keeps the ticket readable and lets developers pull the file straight into their own tools rather than scrolling through a wall of text mixed with human commentary.
Console evidence cuts the back-and-forth loop that eats most triage time. Without it, a developer typically has to ask the reporter to reproduce the issue, wait for a reply, then ask a follow-up question. With a log attached, plus a screenshot and basic environment metadata, that whole cycle often collapses into one pass. Grouping duplicate reports around the same stack trace also gets easier once logs are attached consistently, since near-identical errors become visible at a glance instead of hiding in separate free-text descriptions.
How Do You Capture Console Logs in Chrome, Firefox, and Safari?
The exact steps differ slightly by browser, but the goal is the same everywhere: open developer tools, preserve the log across page loads, reproduce the bug, then export.
In Chrome:
- Open DevTools (F12 or right-click → Inspect) and go to the Console tab.
- Check “Preserve log” so messages survive page navigation and redirects, a setting Chrome’s own DevTools documentation covers for both desktop and remote sessions.
- Reproduce the bug.
- Right-click anywhere in the console and choose “Save as,” or select all and copy, keeping the timestamps visible.
In Firefox:
- Open the Web Console (F12 or right-click → Inspect, then the Console tab).
- Click the gear icon and enable “Persist Logs” so entries stay put across navigations.
- Reproduce the issue, then right-click and export or select and copy the output.
On Safari and iOS:
- Enable the Develop menu in Safari’s preferences on macOS.
- Connect the iOS device and use Safari’s remote inspector to view the console live, following Apple’s guidance on inspecting iOS.
- If a physical device isn’t available, use an Xcode simulator, which surfaces the same console output.
For intermittent network failures or resource loading problems, a HAR file tells a fuller story than the console alone. Export one from the Network tab in any major browser and run it through a tool like Google’s HAR Analyzer before attaching it.
Quick notes for mobile:
- Remote debugging (Chrome on Android, Safari on iOS) is the most reliable path when you have physical access to the device.
- Where remote debugging isn’t possible, pull device-level logs (Android’s
adb logcat, or iOS device logs via Xcode) as a fallback. - In-app capture tools can grab console and network context automatically when neither of the above is practical.
Should You Rely on Automatic Console Log Capture?
Manual capture works, but it depends on someone remembering to do it correctly every single time. In-app automatic capture tools solve that by grabbing console output, network activity, and session context the moment a bug gets reported, then attaching it without the user lifting a finger.
Tools like Loom’s bug report capture mode demonstrate the tradeoff well: it records console.log, warn, and error calls along with network metadata, and it filters obviously sensitive strings before saving. That filtering catches a lot, but it isn’t a substitute for a real sanitization pass on anything headed for a shared ticket.
The upside is consistency: no user has to know what DevTools even is. The downside is that automatic capture tends to grab more than a human would manually, which raises storage and privacy questions fast.
Before turning on automatic capture, run through this checklist:
- Filter known sensitive fields (auth tokens, passwords, payment data) at the point of capture.
- Enable masking for anything resembling personal data in request or response bodies.
- Set a retention window so logs don’t sit around indefinitely.
- Restrict access to captured logs to the people who actually need them.
- Confirm the tool integrates cleanly with your issue tracker so captured context lands on the ticket automatically.
Pro Tip: Turn on automatic capture in staging first and review a week’s worth of tickets before enabling it in production. You’ll catch what your filters miss before it becomes a real leak.
How Do You Share Logs Without Leaking Sensitive Data?
Save console output as a .log or .txt file, and export network traces as .har. Anything under a few hundred kilobytes can go straight into the ticket as an attachment. Larger files, especially HAR captures from long sessions, should be compressed with gzip or zip before upload, following recommended file-size considerations and compression strategies for large logs.

Attach the file. Don’t paste the raw text into the ticket body. A short excerpt inline, five or ten relevant lines, helps a developer decide whether to open the full file at all, but the complete log belongs as an attachment where bug-tracking systems can handle it properly with its own metadata like file name, content type, and size.
Before anything gets uploaded, run it through a sanitization pass:
- Strip API keys, auth tokens, and session cookies from the log text.
- Mask names, emails, and other personal data in request or response payloads.
- Redact full payloads for any endpoint that handles payment or account data.
- If the file exceeds your tracker’s attachment limit, archive it and share a link to a private, access-controlled location instead of splitting it across comments.
| Format | Best for | Compress before upload? |
|---|---|---|
| .log / .txt | Console output, error traces | Only if over a few hundred KB |
| .har | Network request/response detail | Usually, HAR files grow fast |
| .zip / .gz | Any file exceeding tracker limits | Yes, always |
What Should Every Bug Ticket Include?
A console log without context is still a guessing game. Before you file the ticket, run through this:
- Write clear reproduction steps, numbered, in the order you performed them.
- Note the exact timestamp the issue occurred.
- Record the URL or route where it happened.
- Include the app version or build number.
- Attach a screenshot showing the visible symptom.
- Paste a short console excerpt inline (five to ten relevant lines).
- Attach the full log file, and a HAR file if the issue involves network requests.
- Include a session ID if your app or tracking tool generates one.
For anything that resists reproduction after two or three attempts, escalate with a full session replay or an environment dump rather than repeating the same manual steps. A clear bug report structure built around these fields cuts down the questions a developer has to ask before they can even start investigating.
How Combining Screen Recording and AI Cuts Duplicate Tickets
Console logs answer “what broke.” They rarely answer “what was the user actually doing.” Wezardapp pairs screen recording with real-time transcription so the reporter’s narration lands next to the technical evidence, then runs AI duplicate detection before anything reaches Jira or Azure DevOps.
For UAT and support teams drowning in near-identical reports, that dedupe step matters more than any single log file. Fewer duplicates means less time spent re-reproducing bugs someone else already filed. Readers weighing an integrated approach can compare UAT against system testing to see where this workflow fits.
— Marketing
Try Wezard for Automatic Capture and Fewer Duplicate Tickets
Wezardapp is the alternative to stitching together DevTools exports, screenshots, and Slack threads by hand.
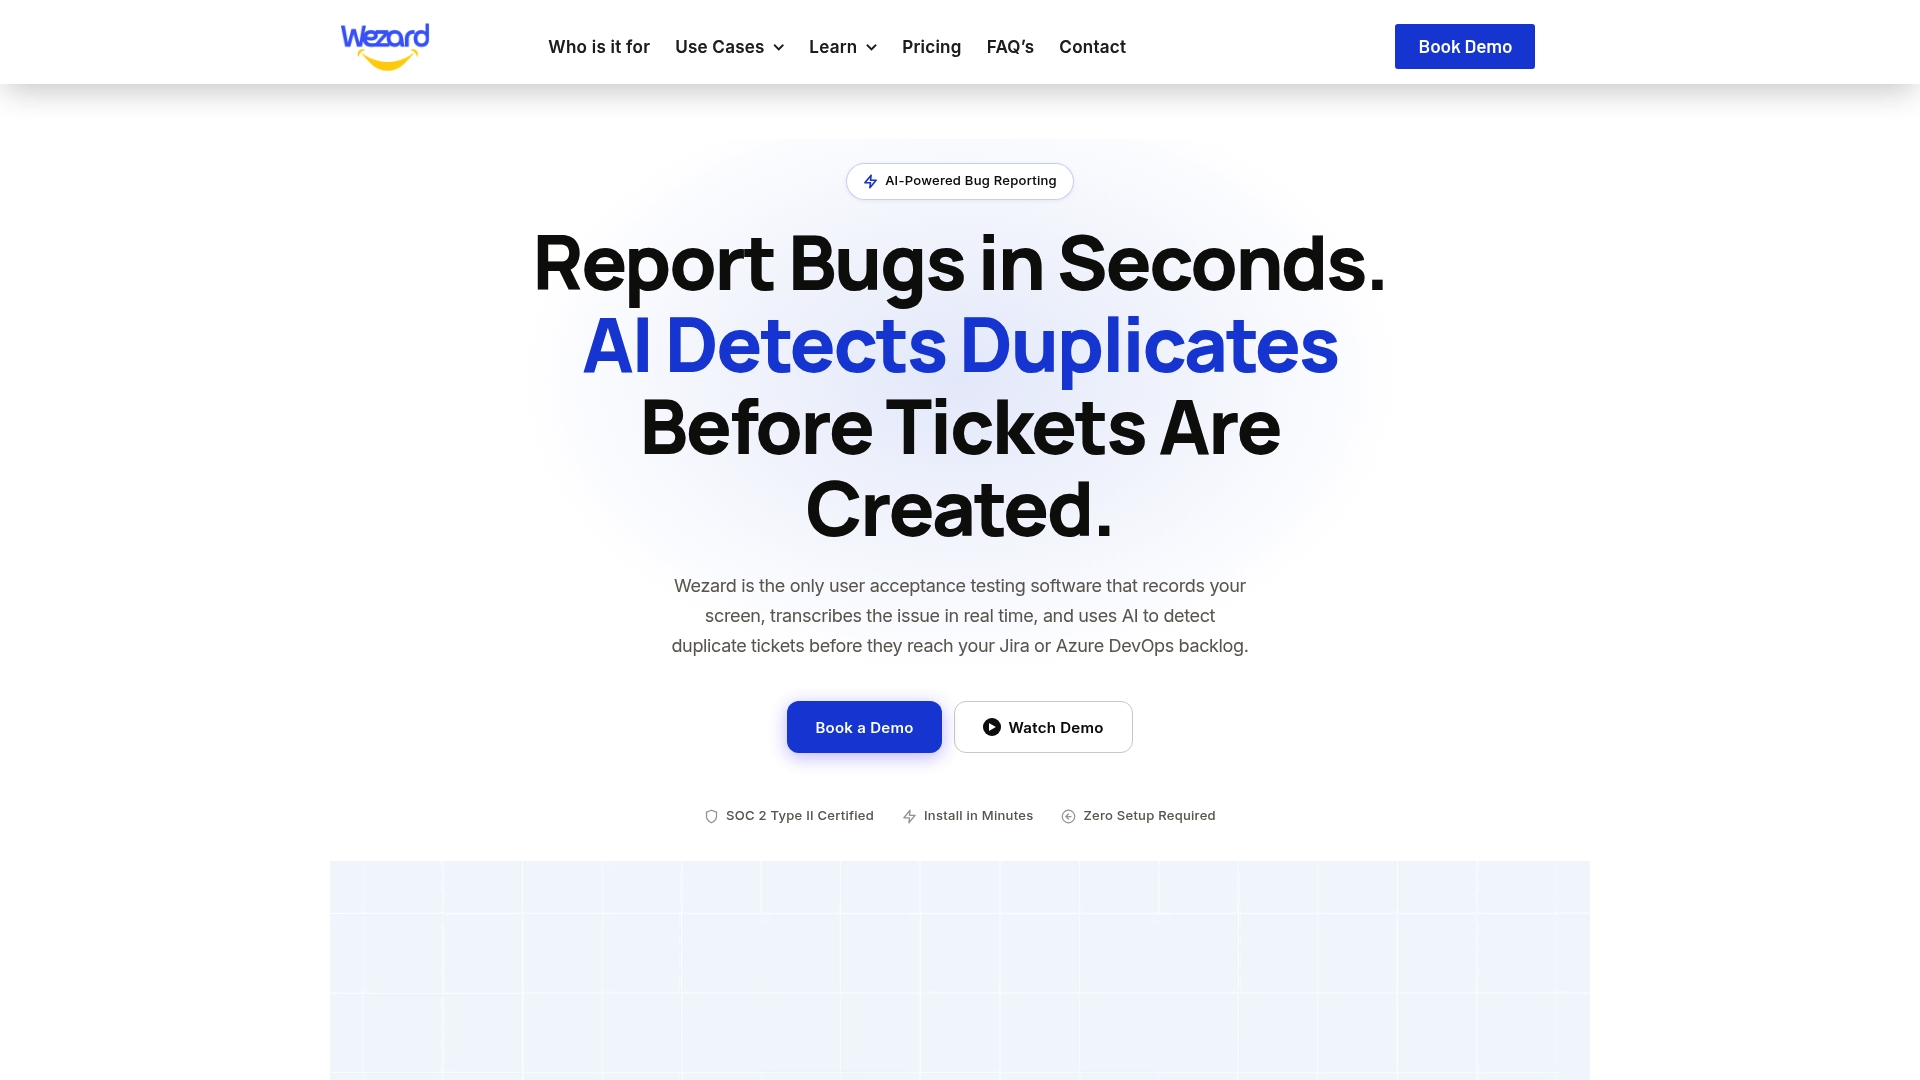
That matters most for teams running UAT cycles with dozens of testers hitting the same flows: without dedupe, your backlog fills with five versions of the same checkout bug described five different ways. Wezard sends enriched tickets, video, transcript, and context, straight into Jira or Azure DevOps with no manual setup.
Plans start at $25 a month on the Starter tier, scaling up through Team and Business for larger QA operations. If you’re evaluating whether automatic capture fits your workflow, check the pricing page and see which tier matches your team’s testing volume.
Sources
- Attach the logs to the bug ticket – Gentoo wiki
- Attachments — Bugzilla documentation
- Capture console and network logs | Loom | Atlassian Support
- Remote debugging — Chrome DevTools
FAQ
How Do I Check the Console Logs in My Browser?
Open developer tools with F12 or right-click and select Inspect, then click the Console tab. Chrome, Firefox, and Safari all show real-time messages there, and enabling “Preserve log” (Chrome) or “Persist Logs” (Firefox) keeps them visible across page navigation.
Where Do I Attach Logs to a Bug Report?
Most issue trackers, including Jira, Azure DevOps, and Bugzilla, have an attachment field or drag-and-drop area on the ticket itself. Upload the log as a file there rather than pasting the text into a comment, since attachments preserve formatting and stay easy to process later.
Why Isn’t console.log() Showing Output?
The most common causes are a filtered log level (check that “Verbose” or “Info” isn’t hidden in the console filter), a script that never actually executes due to an earlier error, or logging inside a conditional block that isn’t being met. Check the console’s filter settings first before assuming the code itself is broken.
How Do I Delete a Bug Report on Android?
This depends on the specific tracker or feedback app you’re using rather than Android itself; most let you open the ticket and select a delete or archive option from a menu, though permissions to delete often require reporter or admin access. If you’re using an in-app QA tool, check its ticket management settings for a delete or archive action.
What Does Wezard Cost for Teams That Want Automatic Capture?
Wezard’s Starter plan is $25 per month, Team is $70 per month, and Business is $160 per month, with Enterprise pricing available on request. Full details are on the pricing page.