
Effective QA reporting is defined as the structured process of delivering timely, audience-specific test insights that drive release decisions rather than simply documenting test results. The qa reporting best practices 2026 demand more than spreadsheets and status emails. Teams that win in 2026 combine AI-augmented analytics, automated dashboards, and audience-segmented formats to answer one question fast: are we ready to ship? With 60% of teams adopting AI-augmented analytics by end of 2026, the gap between teams using modern reporting and those still running manual cycles is widening fast.
1. What are the essential components of an effective QA report in 2026?
A QA report in 2026 must do three things: answer a specific question, for a specific audience, with data that is current. Generic reports that dump every metric into one document fail all three tests.
The core components of a modern QA report include:
- Audience-tiered metrics. Executives need pass/fail ratios and release risk scores. QA leads need defect density and test coverage trends. Developers need failure logs, reproduction steps, and linked tickets.
- Delta sections. Every report should show what changed since the last cycle, not just the current state. A “what changed” section turns a static snapshot into a trend signal.
- Real-time data feeds. CI/CD pipeline integration pulls test results automatically. Tools like TestRail and Jira with Xray or Zephyr plugins eliminate manual data entry and reduce lag.
- Drill-down dashboards. Automated dashboards with drill-down capabilities reduce manual errors and let stakeholders explore data at their own depth without requesting a new report.
- Release readiness scores. A single computed score that aggregates defect severity, test coverage, and open blockers gives executives a clear go/no-go signal.
Pro Tip: Set up a separate dashboard view for each audience tier in TestRail or Jira. A developer view and an executive view pulling from the same data source eliminates duplication while keeping each report relevant.
The tools that support these components in 2026 include TestRail for test management reporting, TestMu AI for automated analytics, and Jira with native or plugin-based dashboards. Each handles the data layer differently, so the choice depends on your CI/CD stack and team size.

2. How does AI enhance QA reporting in 2026?
AI changes QA reporting from a backward-looking record into a forward-looking signal. The shift is not cosmetic. It changes how bugs are classified, how risks are surfaced, and how much manual work the QA team carries.
Key AI-driven techniques shaping reporting in 2026:
- Neural network bug classification. AI-driven reporting tools use neural network classification to assign bug severity based on user pain impact, not just technical criteria. A crash on a low-traffic screen ranks lower than a broken checkout button, even if both are technically “critical.”
- Predictive failure analysis. AI tools scan historical test data to flag modules with high failure probability before the next test cycle runs. QA leads can pre-allocate testing effort to high-risk areas.
- Automated duplicate detection. Wezardapp detects duplicate tickets with AI before they reach the Jira or Azure DevOps backlog. That single feature alone cuts triage time significantly on large UAT cycles.
- Automated ticket creation. Wezardapp records the screen, transcribes the issue in real time, and creates a structured ticket automatically. The AI bug tracking workflow removes the manual step between finding a bug and logging it.
- Defect leakage reduction. Teams targeting a defect leakage rate below 5% use AI triage to catch severity misclassifications before bugs escape to production.
“AI reporting tools advance to classify bugs by user pain impact, enabling prioritized resource allocation.” — BugPilot AI Test Reporting Automation Guide
The practical result is that QA leads spend less time sorting tickets and more time interpreting trends. For project managers, AI-generated severity scores make release risk conversations with stakeholders faster and more credible. You can explore how this shift plays out in practice through the transition to AI-assisted testing context.
3. What reporting cadence and formats work best in 2026?
Stale data is the single biggest failure mode in QA reporting. A report published three days after a test cycle ends reflects a product that no longer exists.
The right cadence follows a two-layer structure:
- Publish within 24 hours. QA teams should publish test results within 24 hours of cycle completion. Reports older than that are considered stale and lose their value for release decisions.
- Daily trend dashboards. A short automated dashboard update showing pass rate movement, new defects opened, and blockers resolved keeps the whole team aligned without requiring a meeting.
- Weekly detailed summaries. A structured weekly report covers defect velocity, test coverage changes, and risk areas for the upcoming sprint. This is the format QA leads use for sprint retrospectives and planning.
- Release readiness reports. Published at the end of each release candidate cycle, these combine all metrics into a single go/no-go recommendation with supporting data.
- On-demand drill-down access. Developers should not wait for a scheduled report to see their failure logs. Live dashboards with filtered views give developers access to their specific data at any time.
Pro Tip: Automate your daily dashboard update through your CI/CD pipeline so it publishes the moment a test run completes. Zero manual steps means zero delay and zero formatting errors.
The format matters as much as the timing. Executives read high-level risk summaries, not detailed failure logs. Developers need reproduction steps and stack traces, not pie charts. Sending the wrong format to the wrong audience wastes their time and trains them to ignore your reports.
4. What are the common pitfalls in QA reporting and how do you avoid them?
Most QA reporting problems come from three habits: treating reports as static documents, using one format for every audience, and burying the key finding in a wall of data.
The most common pitfalls and their fixes:
- Static, manual reports. A report built in a spreadsheet and emailed as a PDF is already outdated by the time it arrives. Replace static documents with dynamic drill-down dashboards that update automatically from your test management system.
- One-size-fits-all formatting. Layered reports for various stakeholders are the standard in high-performing teams. An executive reading a developer-level failure log will disengage. A developer reading an executive summary will miss the context they need to fix anything.
- Burying the risk signal. Effective status reports frame bad news with clear product risk context. Management attention is limited. The risk finding belongs in the first two lines of any executive report, not in an appendix.
- “Same report, different day” syndrome. A report that shows the same metrics in the same format every cycle teaches stakeholders to stop reading it. Add a delta section that highlights what changed, what improved, and what got worse since the last cycle.
- No version control on templates. Report templates evolve as products change. Without version control, teams lose track of which metrics were active during which release cycle. Use a shared template repository with change logs.
- Overwhelming detail in management reviews. Limiting complex report reviews for management optimizes their attention. Reserve detailed logs for QA leads and developers. Executives need a decision, not a data dump.
The underlying principle is that a QA report is a communication tool, not an archive. Every element in the report should help the reader make a decision or take an action.
5. How to choose and customize QA reporting tools for your team in 2026?
The right QA reporting tool is the one that matches your team’s workflow, not the one with the longest feature list. Tool selection in 2026 comes down to five criteria.
| Criterion | What to look for | Example tools |
|---|---|---|
| Composable reports | Build custom report views without developer support | TestRail, TestCollab |
| Configurable widgets | Drag-and-drop dashboard components for different audiences | TestMu AI, Jira dashboards |
| Live data sync | Real-time connection to CI/CD pipeline results | Jira with Xray, Zephyr |
| Trend reporting | Defect velocity, pass rate trends, coverage over time | TestRail, TestCollab |
| AI classification | Automated severity scoring and duplicate detection | Wezardapp, BugPilot |
Modern QA management systems provide configurable widgets, trend reports, and computed release readiness scores. That combination answers the question stakeholders actually ask: “Is this ready to ship?” without requiring a manual calculation.
TestRail excels at test case management and reporting for structured QA teams. Jira with Xray or Zephyr works well for teams already inside the Atlassian ecosystem. TestMu AI adds automated analytics on top of existing test data. Wezardapp fills the UAT reporting gap with screen recording, real-time transcription, and AI-powered duplicate detection before tickets reach the backlog.
Pro Tip: Before evaluating any tool, write down the three questions your stakeholders ask most often after a test cycle. Then test each tool by checking whether it answers those questions in under 60 seconds from the dashboard. If it takes longer, the tool adds friction instead of removing it.
The role of AI tools in test reporting is expanding fast. Teams that evaluate tools on AI capability now will have a measurable advantage in reporting speed and accuracy by the end of 2026.
Key takeaways
Effective QA reporting in 2026 requires audience-segmented formats, AI-driven classification, and automated dashboards that publish within 24 hours of cycle completion.
| Point | Details |
|---|---|
| Publish within 24 hours | Reports older than one day are stale and lose decision-making value. |
| Segment by audience | Executives need risk summaries; developers need failure logs and reproduction steps. |
| Use AI for severity scoring | Neural network classification prioritizes bugs by user pain, not just technical impact. |
| Replace static reports with dashboards | Drill-down dashboards reduce manual errors and keep data current automatically. |
| Add delta sections to every report | Showing what changed since the last cycle turns snapshots into trend signals. |
The uncomfortable truth about QA reporting most teams ignore
Most QA reports are written for the person who creates them, not the person who reads them. I have reviewed hundreds of test status reports across teams of every size, and the pattern is consistent. The report reflects what the QA team tracked, organized the way the QA team thinks, in a format the QA team finds logical. The executive skims it for 15 seconds and moves on. The developer ignores it because the failure data is buried three tabs deep.
Framing status reporting around product risks and release readiness is the single change that makes the biggest difference. Not better charts. Not more data. A clear answer to the question the reader actually has.
The second thing I have learned is that automation does not replace judgment. AI severity scoring and automated dashboards remove the mechanical work. But a QA lead still needs to interpret a trend, flag an anomaly, and explain why a 98% pass rate still means the release should be delayed because the 2% that failed covers the payment flow. That context does not come from a dashboard. It comes from a QA professional who understands the product.
The teams that report best in 2026 are not the ones with the most sophisticated tools. They are the ones who know their audience, publish on time, and lead every report with the risk finding. Everything else is supporting detail.
— Marketing
How Wezardapp makes QA reporting faster and more accurate
Wezardapp is built for teams that need UAT reporting to work without manual overhead. It records the tester’s screen, transcribes the issue in real time, and uses AI to detect duplicate tickets before they reach your Jira or Azure DevOps backlog. That means your backlog stays clean and your QA reports reflect actual unique defects, not noise.
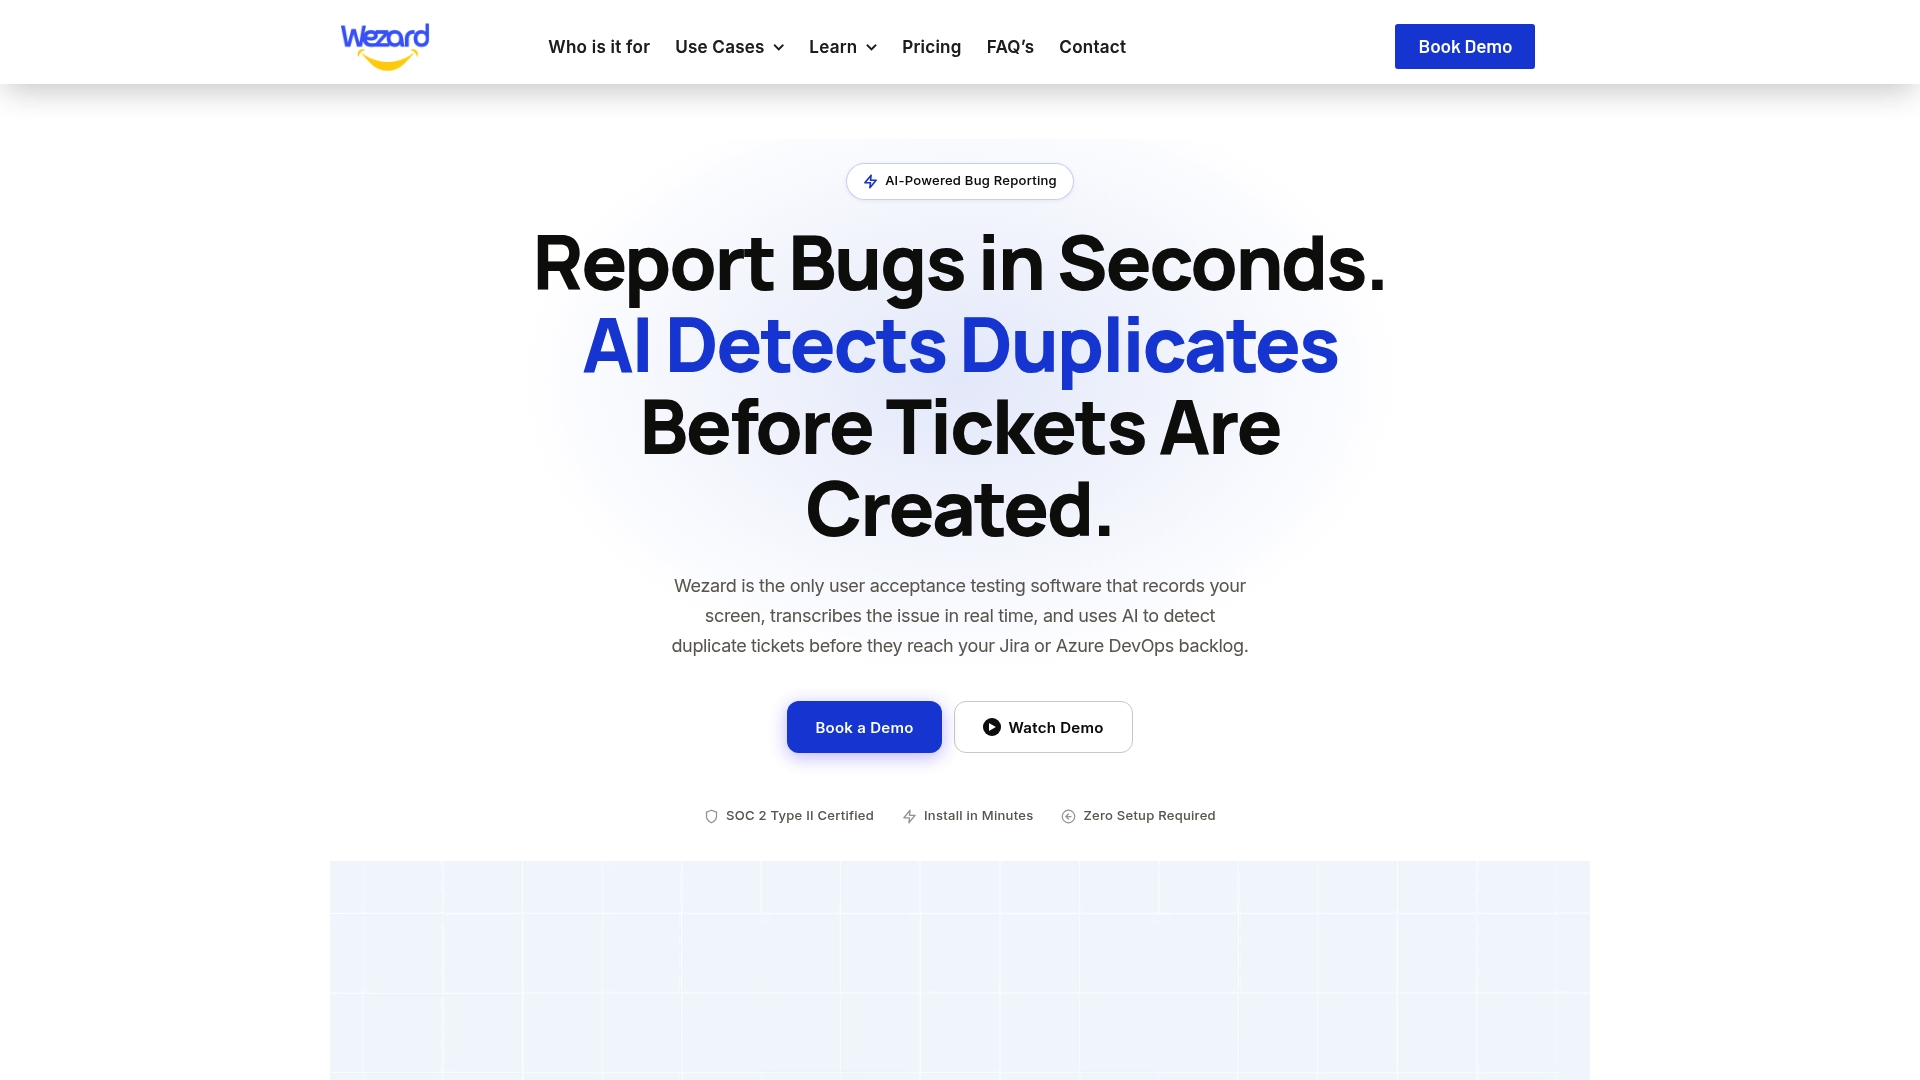
For project managers, Wezardapp’s automated bug tracking gives you a live view of defect severity and ticket status without chasing updates from the QA team. For QA leads, the duplicate detection alone cuts triage time on large UAT cycles. If you want to see how it fits your workflow, explore the UAT testing use cases or check the acceptance testing entry criteria guide to align your reporting with release readiness standards.
FAQ
What makes a QA report effective in 2026?
An effective QA report answers a specific question for a specific audience with current data. The most critical element is framing findings around product risk and release readiness, not raw test counts.
How often should QA reports be published?
QA teams should publish test results within 24 hours of cycle completion. Daily dashboard updates and weekly detailed summaries cover the two main stakeholder cadences.
What is the ideal defect leakage rate for a QA team?
High-performing teams target a defect leakage rate below 5%. Achieving that threshold typically requires AI-augmented triage and severity classification built into the reporting workflow.
How does AI improve QA reporting accuracy?
AI tools use neural network classification to score bug severity by user pain impact rather than technical criteria alone. This produces more accurate prioritization and reduces the risk of high-impact bugs being underreported.
What is the difference between a QA dashboard and a QA report?
A QA dashboard is a live, interactive view that updates automatically from test data. A QA report is a structured document published at a set cadence. Real-time dashboards answer release readiness questions faster; reports provide the narrative context dashboards cannot.